I’m pulling faces that would make a bulldog chewing a wasp look attractive as I power through the second lap of my 10 mile TT test. This year has by far been my most active in terms of cycling mileage and before I start my winter training programme I need to find a measure, a benchmark, I need to stick a stake in the ground where my fitness/cycling ability level currently is.
I am fast approaching my target mileage for 2013, but so are the darker nights. Most of my mileage is the commute to work and as soon as it becomes too dark to cycle at 6pm thats my outdoor season pretty much done apart from the cheeky ride on a weekend morning when the family schedule allows. This year was all about base miles, just to ride the bike, get the miles in where I could and throw in the odd sportive and longer ride when I visit Wales (we holiday here frequently during school holidays and exploring the glorious Welsh roads is a blog in its own right!). Here is an overview courtesy of Strava.
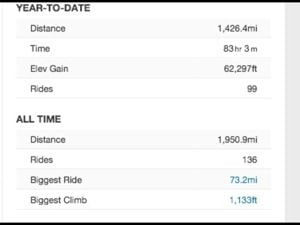
So how cycling fit am I? My biggest ride so far is 73 miles (although on that actual ride it was 85 miles if you include the commute to and from the sportive). I feel capable of completing my first 100 mile sportive, although I imagine it would not be a gracious ride and would probably take in the region of 6.5 to 7 hours. So I don’t think I can measure my fitness on distance alone, I need to incorporate speed. You see for me, I want to get the most out of cycling in the limited time I have so speed takes priority over distance. With this channel of thought I saw the light with time trialling and have since not stopped reading about training programmes to improve 10 and 25 mile TT’s. This will be my winter focus, and potentially could appear a lot more on my cycling calendar next year as the evening leagues fit with my work/life/cycle balance. Either way, improving my speed over these distances should be transferable to longer distance sportives to some extent.
So with these base miles in the bag, what is my 10 mile TT capability right now. Fortunately I live in an extended village built around an exact 2 mile loop that has an elevation variation of 39ft (and I think that is due to the 5 speed bumps on the loop). Perfect for a speed test. After reading various strategies to approach time trialling I set out the door on a sunny midweek lunchtime hoping to avoid as much traffic as possible. Pre ride I try and predict what my cruising speed would be so I know what to target. I set the Garmin virtual partner to 22mph with a slight hope I would win this race. I have managed a 13 mile commute which is rolling terrain (600ft elevation variance) at an average 20mph although this was assisted with a tail wind, other rides have been 19 plus.
I head to the start of the loop, and with the auto lap feature set I go out hard, a little too hard. Reaching 27.5mph, I know straight away I would not be able to sustain this for 5 laps so tone it down a little. I soon set into a rhythm, but notice that I am holding around 20mph, too far off my target pace. The 39ft elevation variation soon becomes noticeable as my speed starts to vary between 22mph and 19mph throughout the loop. My heart rate is at 93% so I know I am pushing hard, and I start getting looks from dog walkers and bus stop crowds as my face muscles also start getting a work out to pull off the level of grimace on display. The sun glasses come off after about 3 minutes in the hope the wind would dry the sweat currently stinging my eyes. After the third lap I was fully understanding that dark place I have read and heard so much about and some how I manage to hold on for another 2 laps. So after 5 laps I average the time trial at 20.9mph, and I have to say I was a little disappointed being short of my pre ride perception. Either way, I put my stake in the ground and have my benchmark, and with it, determination to race my ghost and win.
Power To The People
The problem with measuring fitness without spending big bucks on a professional test is all the variables a ride can throw out you from wind direction to tiredness. I read so much about the benefits of training with power as it levels the playing field completely, but again to access these numbers you need big bucks or a very understanding wife who will let you sacrifice clothing your kids for personal gain.
There is however another option. If you have an ant+ enabled bike computer like the Garmin range, you can buy an ant+ dongle to plug into your computer and head to trainerroad.com. What the clever chaps from Nevada have done is use the published power curve from a vast range of turbo trainers which in addition to the above kit allows the calculation of virtual power. Now there are a number of T&C’s with the readings but the training theory holds up. Don’t expect it to give you your true power number or be able to compare your power with your mates and be within a 2% accuracy tolerance, but it will give you a strong indication. They do however claim to be extremely accurate, but I argue that there can be variables in the initial set up from one trainer to another.
The theory, which also is discussed in Graeme Obree’s Training Manual book is based on constants. If you keep your turbo trainer, tyre pressure and roller contact the same, the power required to cycle 18mph will always be x. trainerroad.com uses this calculation to produce power outputs, and allows you to train with power.
When connected and training to one of their specific sessions you will see a whole host of data on your screen. The bar chart will guide you to your efforts throughout the workout which represents the power required, the yellow line is your actual power produced throughout the workout, and the red line is your heart rate. At the end of the workout you will see something like the graph shown here with various tables of data to help you analyse your workout. The real benefit of this software is that once you identify a training plan to follow (there are a large number of plans to follow included within the monthly $10 subscription) you usually start with a Functional Power Threshold (FPS) test and each workout is tailored to your level. To add to this there are two display types. There is a full screen version or a minimised version that allows you to have the display at the bottom of your screen so you can watch something whilst working out. Now where else can you sit down, watch TV and get fit?
Now I found this nifty bit of software at the start of this year and didn’t get the chance to follow one of their training plans in full. My winter training however will be following one of their plans which is due to start at the end of September, and each month I will either carry out the 10mile TT above and or the FPS test to monitor my progress. The last FPS test I did early this year gave me a reading of 144 watts. In my next blog I will run through the training programme and the results of the initial FPS test which will hopefully show some improvement from 1500 base miles. At the very least I have an inexpensive way to measure and monitor my fitness to track if the training programme works.
Why “too high” – because 2×20 at 85-90% is not sustainable or because the training benefits are not as good as riding at slower pace?I took these figures from the 2×20 thread that ran a few months back: http://www.bikeradar.com/forum/viewtopic.php?t=12555444 That’s what I ride my 2×20’s at anyway (MHR 172 => 146-154), and although the sessions are not what I’d call fun, they do seem to do the trick. Typically I ride 10’s at 90-95% MHR (154-163) as my target zone.