Digital EPO allows people to alter their GPS data to make their ride appear faster than it actually was. But how can you tell if someone has actually used it or not? Are there any telltale signs? It appears that there are…
It’s hard to believe that anyone would actually use Digital EPO. They’re only kidding themselves, right?
But, the human race being what it is, there will always be some folks who will use it to cheat.
Of course, I must point out that for the purposes of creating this post, I created some files using Digital EPO and uploaded them to Strava as “private”, then deleted them afterwards.
How to tell
Here’s a way to tell if a ride has been doctored by digital epo, by looking at the performance charts in Strava.
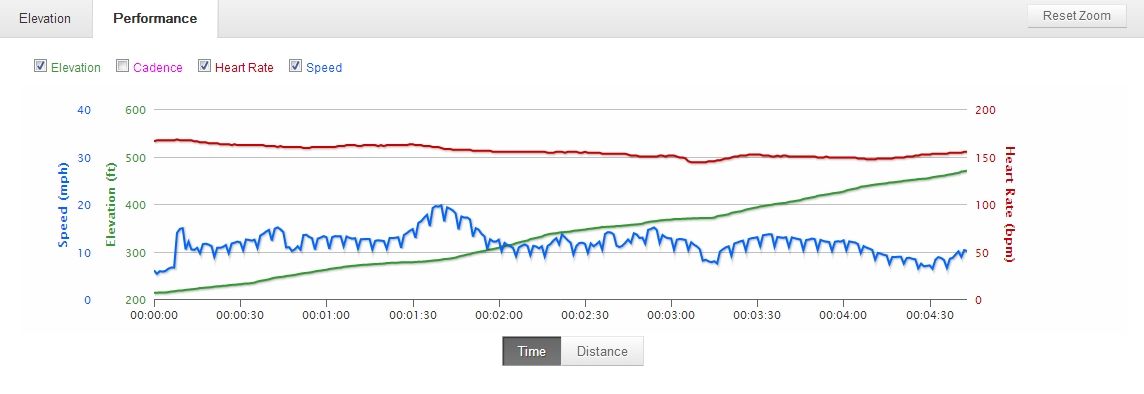
Looking at the full ride, it’s difficult to tell the difference, if any. The first pic is the clean data. the second pic is for a file processed by Digital EPO, to speed up the total ride by 5%
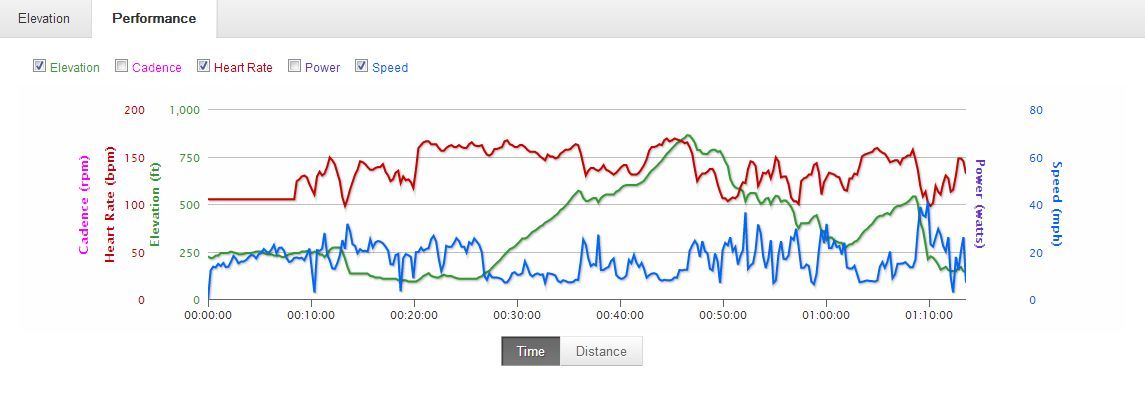
Clean data – full ride – you will need to zoom in!
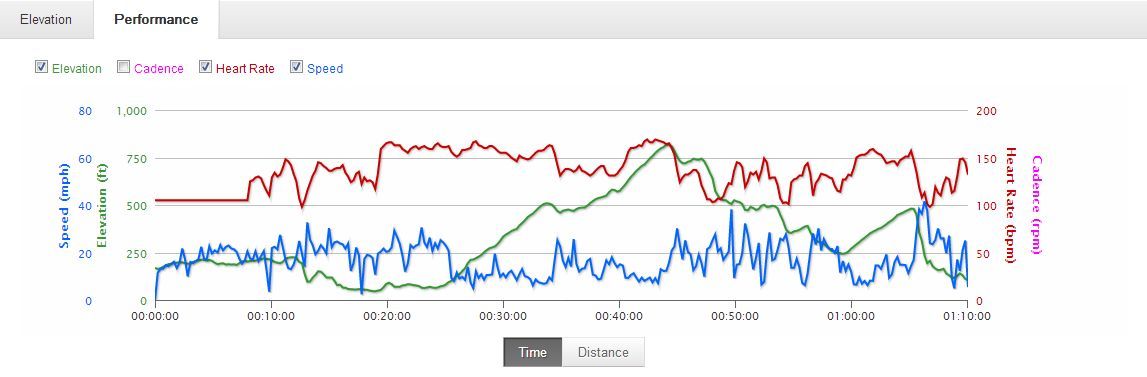
D’Epo file – full ride
You can see that it’s hard to tell the difference between the two images above.
We need to zoom in to see the detail.
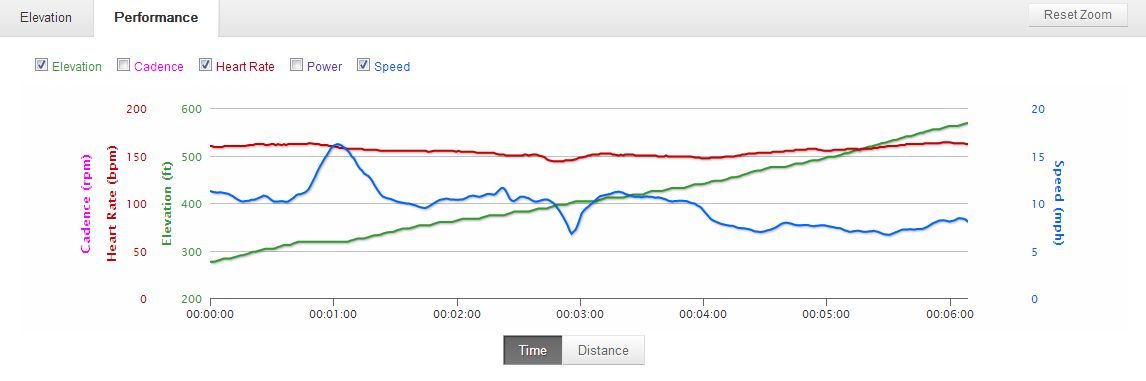
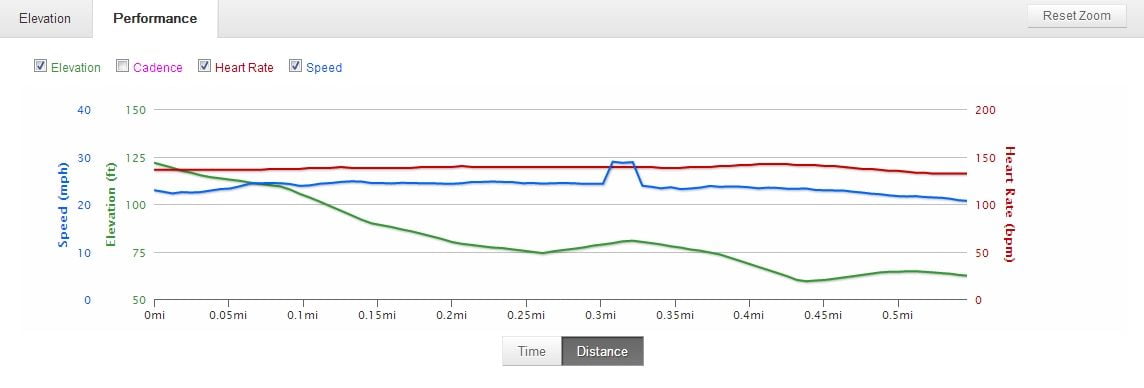
Clean data – zoomed in. Notice the smoothness of the blue (speed) line.
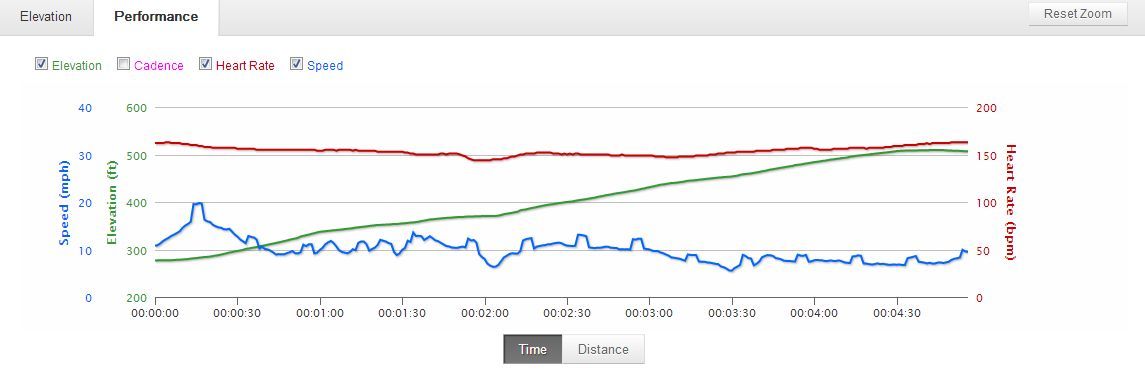
D’Epo data – zoomed in. Notice all those funny little bumps in the blue (speed) line?
This ride’s been juiced, and you should flag it.
Look out for speedbumps
Once you zoom in, the differences become very apparent. Notice how the speed line (blue) is smooth and fluid on the clean ride, but the cheat file clearly shows regular bumps in the data. You can’t miss ’em.
Flag it
If you see bumps like this in the performance graphs of someone who just took your KOM, you can safely flag that ride, because they are a cheating scumbag!
What if people juice their rides by even more – do the spikes look different?
Yes, here’s the same file juiced by 20%
Juiced by 20% – chunky spikes, dead giveaway. FLAG IT!
Finally, what if someone juices their ride by just 1%? Can you still tell?
Yes, but it’s a little more tricky to spot.
You need to zoom in on a section of between a half a mile and one mile, and you’ll see one or two clear little bumps, like this:
Juiced by 1%. The bump is the telltale sign.
These little speedbumps give the game away.
Flag the ride and say goodbye.
Thanks to Darren W for the heads up with this method of detecting Strava cheats.
Please share this post with your Strava buddies so that we can wipe out cheaters.
Click the box below to Tweet this post – thanks!
[Tweet “How to spot a #digitalepo cheat on #Strava”]
Nice one Alan. Very well written up. Good to see you got the same results I did when trying to find a way to detect the juiced rides. The next step is to let Strava know. Perhaps you could point them to this article? If we can see it then surely they could automatically recognise a juiced ride and reject the upload? Strava have a business model to protect, data integrity is important to them. I sense another free year for you :) ….. Ooh and me :)
Gonna have a look this morning. Local guy is suspicous but I hope he’s clean.
Hello Darren W: I’m a reporter working for Bicycling magazine on a story about Strava cheaters, and I believe you helped Alan with this piece. Might you have time to talk? billdonahuewriter@gmail.com/billdonahue.net
Great read but i have a silly question.. how do you zoom on the graph? I see you have ‘reset zoom’ on yours but i dont on mine. Is it a premium extra?
Hi Dave, just click on a point on the chart, then drag the mouse a bit to select the region to zoom in on. I should have explained that in the post! Thanks for mentioning it.
ah brilliant thanks alot, time to investigate some rides :)
Excellent would be interesting to see who is legit in my local area and who is juiced up!
I’m surprised that these bumps exist in the EPO’d data.. surely it won’t be hard to fix this. Then how can we tell? I think we just have to accept that if people want to cheat at Strava, they can
My speed can be quite spiky like that from a straight GPX upload from a Polar GPS.
It isn’t unusual to have a sporadic data speed bump on a Garmin like the 1% example. – maybe once every five rides or so. The 5% and 10% examples, though, are pretty obvious due to the regular pattern.
Can you explain your methodology here? Do you know that you can do this in Excel or any other spreadsheet if you wish. It’s hardly coding skills to do something like this. It took me about 5 mins in Excel to change the the start and stop times to make a gpx file look faster than it is. Strava takes distance and time points and plots a graph from the calculations which is not likely to cause these ‘bumps’ unless you are doing something specific to the file?
Yes I’m aware that it’s possible to manually edit the files as you point out. I’m not sure of the exact method that the digital epo site uses, but clearly the processed file appears differently when viewed in Strava, compared to the original, clean data.
I’ve looked at the files that DEPO sends you and I was not able to recreate the bumps on any of the GPS mapping sites (which I have subsequently deleted). I think you need to publish your methodology as simply saying that because a speed graph has bumps in it means that someone has been cheating is not valid. There are going to be a lot of upset people who have perfectly valid rides being flagged. To me it looks as though somehow you have the data from the files (the real and the juiced one) combined together hence the bumps.So publish your methodology so everybody can recreate it and absolutely sure that you are correct.
I’ve done some further investigation and it would seem that the iphone app uploads with these bumps in it. Now as far as I am aware there is no way of modifying these files before upload. I can send you a screenshot and link to the ride. I think you either need to take down this blog post or at least publish your methodology.
To your point, there are some files that Strava will not support..as in .csv files from a Motorola Motoactv and you can’t directly upload from a Cycleops Joule. So when you convert them via file converters or uploads to Training peaks and Garmin Connect, the resulting magnification of performance also results in the spikes Alan proposes.
I don’t think this is a tried and true technique to snoop out a digital epo rat on a leaderboard, which doesn’t really mean a hill of beans for anyone but he most fragile of egos.
i wish Alan would put his efforts to overcoming the discrepancies inherent in the data plots from the inaccurate iphone/Android apps or the Strava games played with smart data from Garmins or even the facts that the pings rates of some devices aren’t running on the same clock resulting in spreads one can’t overcome.
The iPhone bumps – usually at the start of a ride – are not uniform and exactly the same shape and are not constant as they are in a juiced file. Easy to tell the difference. Those juiced spikes are easy to spot. Export your ride juice it, re- upload as a private ride and take a close look as explained above. You will clearly see the very uniform spikes. Don’t forget to delete :) as it happens I’m not fussed about what people do to their data before uploading it – I’m only interested in mine and local fellow riders as we train together and it saves us using a diary.
I’ve also looked at iPhone rides and I can’t see any regular bumps in the speed profiles, sorry. The method I used is very simple. Firstly, I tried to get the digitalepo site to read my data straight off the garmin, which it did. BUT – whenever I upload the resulting tcx files to strava, they would produce an error and fail. So, plan B was to export the file out of strava, and juice that, as per Darren’s comment (and original suggestion, having first noticed it).
I have a link to a ride which was recorded with an iphone by a friend of mine which clearly shows the bumps all the way through the ride at regular intervals. I wont post it on here as I dont want to invade her privacy. However I can provide screenshots.
I will add when I did what you suggested i,e, export the file I did not get that result but I did export from Garmin connect, as it is a free service rather than Strava, which suggests that there may be an issue with the export process and also the fact you used a tcx file rather than a gpx file which can also be used.
Isn’t riding in a pace line doping your strava file too?
I suppose it is if you upload it to Digital EPO. This post was about data manipulation, lots of us ride pace line and chain gang and god forbid we go faster with a tail wind. I’m yet to see a pace line that didn’t fall to bits going up and down decent hills, well not at club standard anyway. I don’t have any issues with pace line. If a strava seg is a sprint section a pace line won’t win a KOM anyway as you won’t be going balls out sprinting for your life. Usually you will be working at a manageable pace for all in the line over a decent distance :) If a few people want to work together and train and get good times or even KOMs by draughting then STRAVA has done its work and encouraged and motivated them. That’s got to be a good thing for our sport.
Excellent article. I never thought that you can spot juiced up rides until I read this. One thing I have to mention, though – The Strava app for Android also produces those speed bumps similar to the ones produced by the Iphone app. I just checked one of my rides where I used the Android Strava app and saw those bumps, but they’re not consistent and appear only on climbs and not when going downhill or on the flats. This particular ride was flagged just days after it was uploaded and I’m not surprised why after reading this article. The person who flagged it was probably familiar with the info presented here
I don’t care about cheats, they’re cheating themselves, not me. I have much better things to do than zoom in on other peoples data readouts. Bikes don’t clean themselves.
Nice going!
is the spike the same if someone just has bad gps signal? if it is then they might not be cheating
Tweet @stravadopers with Strava athletes suspected of using digital EPO and they’ll help you flag them down.
twitter.com/stravadopers
#Strava #cycling #kom #doping #cheaters