The Veloviewer infographic has been updated and improved for your 2017 annual summary of all your Strava activities.
This is the third incarnation of the Veloviewer infographic. It’s a nice way to reflect on your riding over the course of the year.
It came as no surprise to me that my total for the year will be (once again) nowhere near the level I achieved in 2013, but I’m not beating myself up about it.
 I ride to keep well, and it works. It’s that simple.
So whilst I’m fully aware that I’ll never break any records, it’s still satisfying to see a visualisation of your annual cycling data, to jog the memory and perhaps more importantly, get you thinking about the year ahead.
Veloviewer Infographic 2017
For those of you who might be completely new to this, you will probably appreciate knowing that the actual ride data comes from Strava, so you need to be an active Strava user for this to work. You can then visit Veloviewer, connect your Strava account, and it will do the rest of the magic for you.
The Veloviewer infographic has changed a bit for 2017, with more options to play with so you can customise it more to your liking.
There are more options to play with this year, as you can see in this screenshot. You can include/exclude rides/runs/swims, and choose from lots of other options to tweak your own infographic, so have fun!
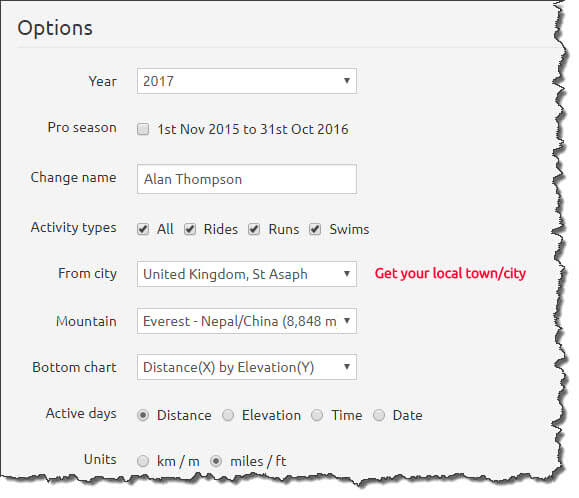
Lots more options to play with!
Here’s the latest version for your 2017 summary, followed by previous versions so you can see how it’s changed.

Veloviewer Infographic 2017 – Click the image to get yours!
Generate your own Veloviewer Infographic now!
Veloviewer Infographics of yesteryear!

Veloviewer Infographic 2016
“It’s Strava stats 2016 annual summary time!“

Veloviewer 2015 infographic
“Beautify your Strava stats with this amazing infographic.“
Visit Veloviewer now to generate your own infographic
How did you do in 2017?
How was 2017 for you? What were your goals, and did you meet them?
What are you aiming for in 2018?
Let us all know in the comments below.
What are you aiming for in 2018? Let us all know :-)
Nice article! I’m not going to brake any records either, but watching my results in such a cool infographic adds some extra motivation to keep cycling. As for this year, I started using Strava a couple of months ago and I ran my first Gran Fondo and I’m about to finish my first Festive500 too. Next year, I’m planning to tour along the Shimanami Kaido with my wife